
As far as I know, there are only 2 ways of trading that produce positive results in the long run for retail traders.
Method #1: Short Term Price Action
This is a reactionary approach to trading.
Allow me to explain.
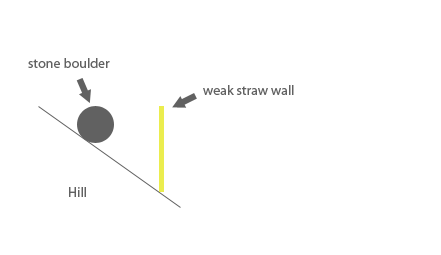
Imagine a large boulder rolling down a hill, towards a wall.
Now, depending on what that wall is made of, the boulder will either smash through it, or be stopped by it.
If the wall is made of straw, the boulder is going to break through it and continue rolling down.
If the wall is made of thick concrete, however, the boulder is going to be stopped by the wall.
Now imagine that instead of a boulder, you’re looking at falling prices.
Prices are dropping aggressively, towards a support level.
Depending on the strength of the support level, prices will either break through that barrier, or be stopped by it.
In this manner, price action trading essentially involves taking trades based on how moving prices react to support/resistance levels.
So it’s a reactionary approach because you’re trading based on the interaction between 2 conflicting forces (i.e. falling prices vs. the support level). How these forces interact determines how you trade.
The Downside Of Trading Short Term Price Action
On its own, price action trading tends to be relatively unpredictable because there are larger forces at work ‘behind the scenes’ that the trader may be unaware of.
In predicting whether the boulder will smash through the wall, amateur traders simply look at how large the boulder is, and compare it to the strength of the wall.
If it’s a large boulder and the wall looks weak, they bet on the boulder.
This works, sometimes.
Other times however, the amateur trader loses money even though the boulder is large and the wall is weak:
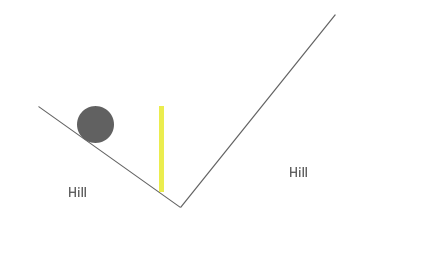
What would happen here?
The boulder would smash through the straw wall, but the larger (steeper) hill on the right would cause the ball to roll right back!
In this way, price action trading focuses only on what’s happening immediately on the chart while ignoring the bigger (environmental) picture.
So while it can be an effective way to trade, price action trading is vulnerable to the larger fundamental (i.e. economic) forces that could easily override it…
… which brings us to the next trading approach:
Method #2: Longer Time Frames With Fundamentals
This approach involves understanding the larger context of the market.
It’s like understanding the surrounding geography of the rolling boulder:
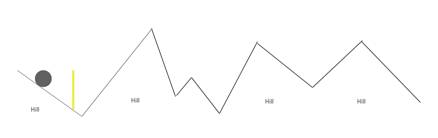
When you understand the fundamental context of the market, the immediate price action becomes less significant.
Price action is important… but when faced with conflicting fundamental forces, it usually gives way to the latter.
The Dangerous Middle: Technical Indicators
Price action trading looks at the immediate, short term time frame, while fundamental trading looks at the larger time frames.
I’ve found these two approaches to be the most reliable ways to trade.
Now, in the middle of these two extremes is trading with technical indicators.
Imagine the same boulder rolling down a hill.
Now it is approaching a wall.
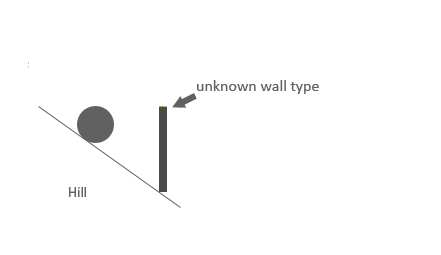
Technical indicators (such as the moving average) would at this point suggest that since the boulder has been rolling down all along, it is likely to keep rolling down.
This method ignores the wall type, and the bigger environment – all it pays attention to, is what the boulder did in the past.
When walking forward, do you keep your eyes on the footprints behind you? Because well, there’s basically what most technical indicators do.
Technical indicators simply re-organize the price information that’s already known (i.e. historical price data). They do not consider new information (like price action does), or information outside of the trading chart (like fundamental analysis does).
And so the reason I don’t use technical indicators is that they lag too much compared to price action, while at the same time provide no understanding of the bigger fundamental (i.e. environmental) picture.
The day I broke free from technical indicators
I remember the day I decided to delete all the technical indicators off my charts.
It was uncomfortable at first, as I was so accustomed to the feelings of certainty and security that they provided.
Staring at the bare price chart, I was struck by a sense of helpless uncertainty.
Without some structure of technical indicators wrapped around the candlesticks, the market seemed to be a lot more erratic and unpredictable.
The price chart had not changed – it showed the exact same price data as before. But why was I feeling so helpless looking at a bare price chart?
I soon found out that that it was my perception of the price chart that had changed.
Certainly Uncertain
In the past, technical indicators helped me feel like I knew what I was doing – they gave me the confidence to take trades.
I didn’t have to learn about economic fundamentals or to make my own decisions, because all I had to do was follow what the colored lines told me to do. “When the blue line crosses the red line from above, sell; When it crosses from below, buy”. My only responsibility was to follow instructions like these.
But when I finally decided to trade without them, I was suddenly confronted with the reality of the market – that uncertainty is a crucial component of the market.
All along, I had been relying on technical indicators to give me some sort of certainty in my trades.
But now I understand that beyond a (very) limited extent, that certainty is an illusion – the market does not move according to technical indicators, even though it might seem that way.
I had been looking for certainty when in reality there was none to be found.
Looking back now, although it was an uncomfortable transition, I’m glad I’ve learned to embrace the uncertainty of the market.
It keeps me flexible, ready to challenge assumptions and able to switch sides in a matter of seconds.
There is no ‘right’ or ‘wrong’ in the market, only the reality and the illusions.
And when you ask the right questions, you get closer to reality and further from illusions.
If you can’t find the right answer, perhaps you’re asking the wrong question.
Getting Closer To Reality
The fact of the matter is that many (if not most) retail traders are either too lazy, or can’t be bothered to search for the truths behind what it takes to succeed at trading.
They want some indicator or software to tell them exactly what to do.
They buy course after course thinking they’ll find the magic key that opens the door to untold riches.
But what they don’t realize, is that they are the key.
Decide For Yourself
I’ve come across countless books, videos and courses that told me how I should be trading.
Unfortunately, most of them did not explain why I should be trading in the way that they recommended.
As I mention in Positive Expectancy, one important question to ask is ‘why’.
Unless you understand why you’re trading in a certain way, you are helpless.
If you understand the ‘why’, you become free to follow, modify or re-create the trading approach to suit your personal circumstance and preference.
This is the only effective way I know to build the key – that is you – to open new doors in your trading journey.
Hi Chris,
Regarding Price Action Trading: As I continue to feel my way forward, I too am headed in the direction of no indicators. This is because of what you say regarding forward looking vs. rear view mirror trading. Speed of momentum and direction of momentum (stoch, macd, rsi, etc. oscillating indicators) do change before price, so I think there may be a place for these, but overall, it seems price action does get one into and out of trades earlier/safer.
Regarding Fundamentals: I am open to new learning, but have studied these for several years. Intermarket analysis, money supply changes, inflation/deflation, gdp, debt/deficits. Sometimes these tell one what the market “should” do rather than what it “is” doing. Many times, I’ve seen a market do directly the opposite of what should happen. Recently, for example Non-Farm Payroll was released. Based on ECRI and other recession calls, I surmised job would come in weak (which they did) and soften dollar strength. Instead, USD/CAD initially spiked in the opposite direction. Maybe it will ultimately go where it is supposed to go. Trader Ed Seykota even call these “funny mentals.” You must have a way of using this that works. I would very much like to incorporate this into my trading so I am taking trades in the direction I think things are going to go and avoid the associated conflict in taking opposite set ups.
Thanks for your insights,
Greg
Hi Greg,
You are spot on about the fundamentals – market prices do not always move in the “expected’ direction.
So there’s an element of randomness we need to account for in our trading.
Hi Chris, this the first time I seen the truth in writing about the reality of trading forex. Based on this statement it would seem that candlestick analysis and support/resistance are the way to trade. I have followed your posts for some time and have benefited from your trading insights. Thank you, Regards Bryan
This approach seem’s well and good, Now which time frame is the best to watch? 1-5-15 M. Seem’s every time I buy in price goes the oppisit direction. I feel i’m being watched.
Hi Edward,
Paying attention to the immediate price action on the 5- and 15-minute charts may be useful, but actually trading on those timeframes might not be a good idea.
As covered in the Retail Forex Manifesto, the pip spread charged by brokers makes it a losing game for traders who take small profits (i.e. 20 pips or less).
Personally, when trading price action I stick to the 1 hour and 4 hour charts.
Hi Chris
Great article as usual!
It’s true what you write that most every indicator is worthless due to the fact they all lag & that price is random to a retail trader. It’s money that moves price & it’s the big dogs that have the amount of money to do so.
Chris, what are your thoughts on divergence?
I to am one that has basically stripped all indicators from my charts except the MACD. I now trade only 2 set ups when they have extremely great R/R (Regular Divergence and Hidden Divergence.) I recently have hit many home runs using this method.
Thanks for all you do!
Hey Gary,
I find divergences to be (relatively) more reliable than simply using indicators the traditional way.
Personally though, I would only consider trading divergences in the context of the fundamentals.
Hi Chris,
i am writing out of sheer frustration i have tried trading using just price action, theories that the big banks manipulate the movement of price, indicators i could go on and on i dont want to give up i have never been a quitter i want more than anything to make a full time living trading and being free to do what i want in life, i just cant seem to breakthrough i know that you must have felt what many of us are feeling right now, i need to find someone who is genuine about helping failing traders, can you help me.
kindest regards
Hi Tino,
I really get your frustration because years ago, I’ve been there.
The best advice I can give here is to invest in the Icarus trading course.
Tino has spoken my heart and frustation
hi Chris,
its a nice write up, ur icarus course will do,how much does it cost and is it possible fot nigerian to get in nigeria here. i have traded for 6 yrs and nothing to show for it, but its on part time basis as i have my job between 8.00 am and 3.30.pm daily. how can you help me out.
thanks for your blog
Sorry, I don’t think there is an advantage to ignoring information. I agree the more info like fundamentals is good. But I like to see the divergence that Macd shows as well. I think there is room for both.
Hi Chris,
In order to see what is really happening on price action I have been advised to use Renko bricks on the charts – do you know much about this and how to use the renko “bricks”?
Hi Tony,
Personally, I’ve not found Renko charts to significantly improve my trading, so I don’t use them.
Have you published any books? I like your blog but would like more. Thanks and keep up the hard work.
Hi Doyle,
Thank you for your kind words!
The only book I’ve written (so far) is Candlesticks Made Easy.
If you have anything in particular you’d like me to write about, let me know at support[at]pipmavens[dot]com.
Hi Chris,
I enjoyed the article so much and it is a different approach about the
forex trading. The statement “If you can’t find the right answer, perhaps you’re asking the wrong question” is only the nutshell of all.
Very great and I expect more. You are dealing the thing in accordance with the nature. So, we must coincide with the nature, the latter will not come to us. It is well explained and it is true for ever.
SUBBANASARi PASUNGILI
Thank you for your kind words… I’m glad you’ve enjoyed the post!
Good insight and helpful, thx Chris
Hi Chris,
Moving averages are a must if you want to get rid of indicators, otherwise it is “blind-folded” if doing so called naked-trading..
Hi Alfred,
Thanks, I appreciate your comment!
Personally, I haven’t used a moving average for years now and it has served me well. But if you’re sure it works for you, I say go for it.
Your article seems to be interesting. Can You elaborate more on your trading system………Thanks
Hi Rahul,
You can check out my trading method here.
You have to pay for that.
If you don’t know to use technical indicators properly, it doesn’t mean that these are scrap or useless.technical indicators work for me and I don’t have opinion that price actions and fundamental analysis are the only way to succeed in long run.thats just your personal opinion but not 100 percentage true
Mind showing your performance statistics?
I trade on swings & on Elliott wave & make money. My objective is to save my capital with a minimum risk. some time to wait to trade till it comes to support levels. I do not trade by timing the market but I time my investment.
Do feel I am on the right track . Pl suggest improvements.
also pl increase the size of screenshots to make it readable.
HI CHRIS
GREAT WEBSITE AND ARITCLES
PLEASE WRITE ABOUT HOW TO DRAW SUPPLY/DEMAND LINES ON LONG TIME CHARTS AND TRADE BASED ON CANDLESTICK PATTERNS ON THOSE LINES…THAT WOULD BE HELPFUL TO MANY TRADERS…RGDS ESSAR
Hi Essar,
The topic of supply/demand levels are covered in the Icarus Project, so I’m afraid I can’t share my insights of them here.
But do let me know if there’s anything else you would like me to write about here at the blog.
Chris I’m not so convinced about the efficacy of candlestick patterns. Since learning about engulfing and pin bars I have identified these in charts of previous periods. I’m hard press to find a pattern that warrants confidence in them for trading. Of course, one of the dangers when reviewing past data is “confirmation bias”. We tend to relationalise the subsequent price movements to be consistent with our theories. Trust me I want to believe in them. But I suspect that forex traders and educators have over-sold their benefits.
What is your real trading experience with candlestick patterns? Or am I being too cynical 🙂 Alex
Hi Alex, I find “candlestick patterns” to be mostly a marketing gimmick and of little (but some) practical trading value. The key to reading candlestick price action is understanding the context behind the candlestick formations. This is why I teach people how to read candlesticks like a story book and not to blindly memorize them.
Hi Chris
The more i read of your writings the more i agree with you. There are too many writers who offer simple mechanistic solutions – indicator(s) or patterns and then place your trade. This must be easy pickings for the big institutional players.
Keep up the good work.
Thanks Alex, I appreciate it!
I’ve read your posting a few times and each I appreciate your comments even more. I have been on the indicator, expert advisors, and training secrets merry-go-round. Your posts are refreshingly honest and treat readers as intelligent and not easy targets for the latest scam.
Thanks again.
Indeed! I find most retail traders to be more intelligent than the average person on the street.
Hi Cris
this is wonderful post. I learned many thing from it
thank you so much.