One of the most overlooked aspects of Forex trading is the cost of opening a trade position.
At the usual cost of 2 – 4 pips, the bid-ask spread is not something that’s taken seriously by retail traders.
In fact, I would say that it’s typically ignored.
After all, it’s not something that traders can avoid… so why worry about it?
To understand this issue, let’s look at the graphical representation of the bid-ask spread on the trading chart.
View The Bid-Ask Spread In MetaTrader 4
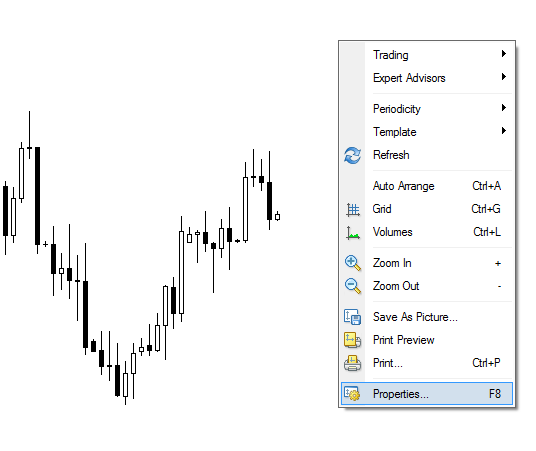
First, right-click anywhere on the chart and click “Properties”.
In the chart properties window, select your choice of colors for the bid and ask lines.
The “Grid” color = Bid line color
The “Ask line” color = Ask line color
For illustrative purposes I’ve selected red for the bid line, and blue for the ask line.

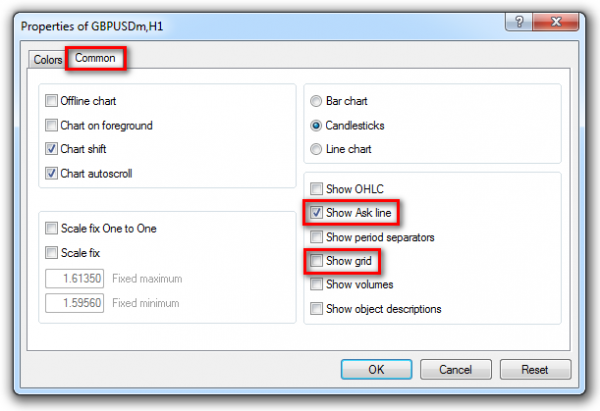
Next, go to the “Common” tab.
Check the “Show Ask line” radio button.
Un-check the “Show grid” radio button.
Then click “OK”.
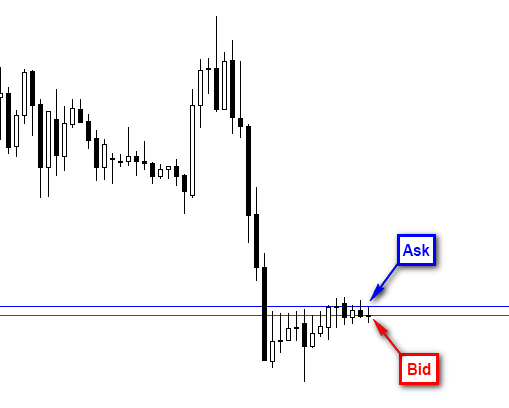
And voilà, you can now see the bid-ask lines on your trading chart.
But What’s The Point Of This?
The bid-ask spread is an operational expense. It’s the cost you pay regardless of whether you profit from the trade.
And the larger the spread is – in relation to the profit potential – the less worthwhile the trade is.
Let’s look at a chart example:
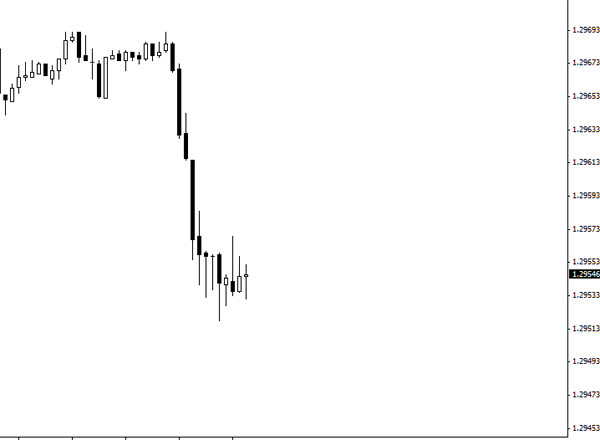
Here you can see that prices have dipped significantly, and is now consolidating.
If you’re an intraday trader or scalper, you might be looking to profit from this ranging price action.
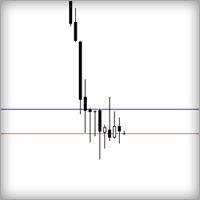
But look what happens when we include the bid-ask spread on the chart:
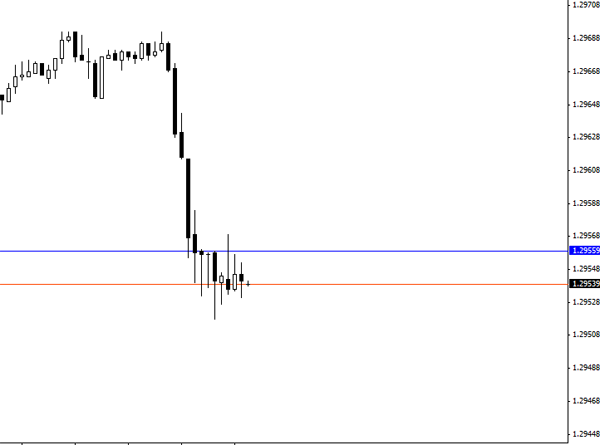
As you can see, the bid-ask spread (the area between the blue and red lines) takes up most of the ranging price action.
To make a profit in such a situation, you’d not only have to correctly anticipate prices continuing to consolidate, you’d also have to click fast enough catch prices at the top and bottom of the range.
In the image below, the yellow areas are where you’d have to enter a buy/sell trade in order to make a profit… of just 1 – 2 pips.
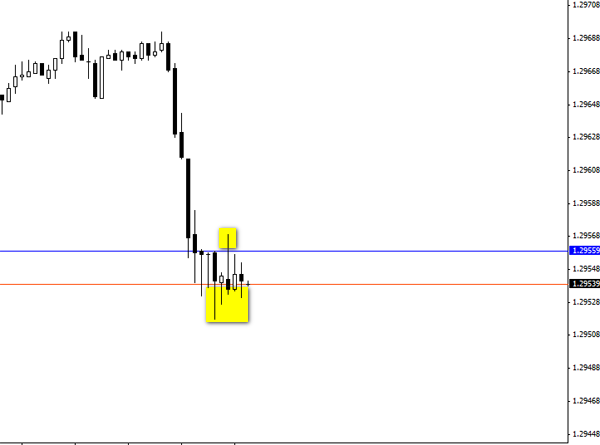
So which time frame do you think this chart is showing?
It’s the 5 minute time frame.
Now contrast this to a similar situation on the 1 hour time frame:
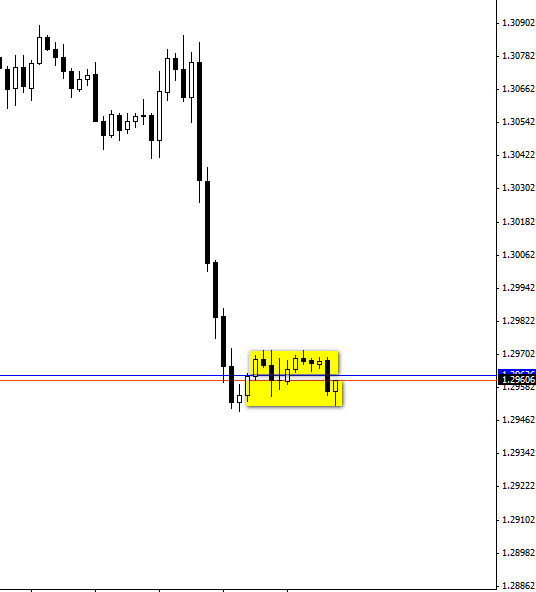
Since the spread is proportionately smaller in relation to the price swings, we get a lot more opportunities for a larger potential profit of 6 – 10 pips.
This is an often overlooked detail of short-term trading, which significantly reduces its profitability and sustainability over the long run.
If you’re going to be trading for a long time you’ll need to adopt a trading approach that stacks the odds in your favor.
Based on the 2 examples we’ve just seen, it’s clear which one offers more opportunities for a profit (i.e. fewer losses), and with a larger profit potential.
Don’t Sell Ice To Eskimos
Short-term trading is appealing to many traders because it promises “quick profits” and “instant wins”.
The reality of it however, is that it is a way of trading where you are most unlikely to keep winning.
In the meantime, your broker will be smiling all the way to the bank with the huge chunk of fees it has collected from you.
As with many other areas in life, it pays to choose to play the game that gives you the best chance of winning.
I Hope This Guide Has Been Helpful
What do you think of this quick guide? Let me know in the comments below, and feel free to check out my other guides/posts on the right sidebar!
Yes it is helpful.
Chris, thanks a lot. This is one trick that I am going to use. I hope that you will share more with us.
Arnold
Yes, I agree with you, Chris: Icarus Method is so realistic and productive method for retail traders like us…the Pipmavens.
In addition, I would like to say to non-Pipmavens traders, especially to scalpers: this blog help to open the eyes,because it shows exactly how Forex Brokers are recruiting many many amateur retail scalper traders to contribute (with their own money of their live account, in rising of banks capital and assets. Unfortunately, this is the truth of the Market Field…And lucky Pipmavens that are participating on the other side of the Market Field,…on the side of winners!…
TQ chris,good point
It all depend on the volatility of the day, on news day, scalping will be profitable, normal day, then it may be useful as a reminder not to trade. Thanks
Very useful information. Depending on one’s “time preference” the
bid-ask spread can obviously make a BIG difference.
THANKS CHRIS THAT WAS HELPFUL !
CHEERS !
KEV
Exalente ¡ Chirs , me sirvio de mucho tu comentario , seguire tus consejos que son muy valederos para mi , gracias y un abrazo ¡ … Maestro ¡ …
Hi guys,
I’m very glad to know that this post has been helpful.
I’ll definitely be putting up more of such posts in the future.
Hi Chris
Thank you for taking the time to explain even the most obvious. Forex is complicated. We all can thank you for your efforts. I have learned many things from you and I hope to be like you some day!
Thank you!
Carl
Chris,
thanks a lot. Very useful information indeed. I hope that you will share such kind of informative information more with us.
My new year’s trading resolution; Never trade short term time frame only 4hrs upwards. This year I failed dismally trading 1hr and 15min TFs. They are the waist of time and money stealers. Of cause that is my opinion and experience.
Thanks for useful info,still wish could afford Candle sticks made easy but still not in a position to purchase at this time
God bless
Richard (South Africa)
Hello Chris
Thank you for this it was one area I was doing not doing my best to control. Also thank you for showing us how to put the bid/ask price lines on the charts.
Ralph
Great information. I am a beginner at forex trading and I appreciate this information reached me at my earliest.
Thanks bruh
Thanks so much Chris,
This was exactly what I was looking for after tiring to do on the fly spread calculations to see short term profit potential. so Thank you and I cant wait to read more :D.
Hi Michael,
You’re most welcome. Glad I could help.
great article, thanks. I think you may have the Bid & Ask boxes the wrong way round on your first screenshot example above. The Ask line is above the Bid.
I think the longer trading times are better for trading.
Thanks!
Good read well explained
A long, long time after… (I just saw it)… Thank you. Gotta realize that the bid line is the same color as the grid and one has to turn the grid off – but the bid line keeps the color same as the grid… thanks MT4 developers for messing this up.